
Risk Management
Natural Capital Depletion: Avoiding the Impacts of Raw Material Extraction on Natural Capital
Mineral
Electronic products require a variety of functionally significant metals depending on their performance needs, among which tantalum, tin, tungsten, and gold are essential for the operation of electronic devices. These metals are used in manufacturing components such as resistors, capacitors, central processing units, hard drives, memory modules, motherboards, and connectors. In 2024, analysis showed that the metals used by ASUS were sourced from 693 smelters, with the distribution as follows: Asia 62.0%, the Americas 14.8%, Europe 14.8%, Africa 7.5%, and Australia 1.0%. In line with the Organization for Economic Cooperation and Development (OECD) due diligence procedures, ASUS conducts supply chain smelter investigations, establishing management mechanisms, identifying and assessing risks, formulating risk mitigation measures, and disclosing management results to ensure responsible minerals management. Since 2018, 100% of ASUS’ tantalum, tin, tungsten, and gold have been sourced from qualified smelters, thereby avoiding issues such as labor exploitation, armed coercion, child labor abuse, and environmental destruction caused by illegal operations.
As one of the designated responsible minerals, tin is not only prohibited by ASUS from being sourced from conflict-affected areas but also monitored for origins linked to unsustainable mining in Indonesia. Unregulated extraction, coupled with neglect by multinational corporations, has resulted in poor working conditions and severe environmental damage in Indonesian mining operations. The Indonesian Tin Working Group—a coalition of electronics companies, tin producers, industry associations, and civil society advocates—seeks to address these challenges. ASUS has joined this organization to support project initiatives aimed at mitigating the environmental impacts of unsustainable mining in the region.
Cobalt, a critical material for battery production, is another focus area. According to the European Union’s Critical Raw Materials Review Report, one-third of the world’s cobalt is sourced from the Democratic Republic of Congo and neighboring countries, where illegal mining risks are prevalent. In 2019, the Responsible Minerals Initiative (RMI) classified cobalt as a fifth-category managed mineral. ASUS has developed a five-year smelter qualification transition plan, requiring suppliers to progressively increase the proportion of cobalt sourced from qualified smelters, with the goal of achieving 100% qualified cobalt sourcing by 2025.
Packaging
According to a 2016 study by the World Economic Forum and the Ellen MacArthur Foundation, most packaging is used only once, and of the vast amount of plastic waste generated afterward, only 5% is effectively recycled. As a result, since 2018, countries around the world have been implementing plastic reduction policies to achieve the vision of a circular plastics economy. Since 2019, ASUS has replaced PE bags with PET non-woven fabric and increased the use of recycled pulp to 90% in paper-based packaging materials. Extending its commitment to resource and ecosystem protection, ASUS began sourcing Forest Stewardship Council (FSC)-certified paper in 2020, using over 1,090 metric tons to date. In its core product—laptops—ASUS uses over 90% recycled paper and is progressively incorporating more environmentally friendly paper materials.
Environmental Quality Degradation: Mitigating the Value Chain’s Impact on Natural Capital
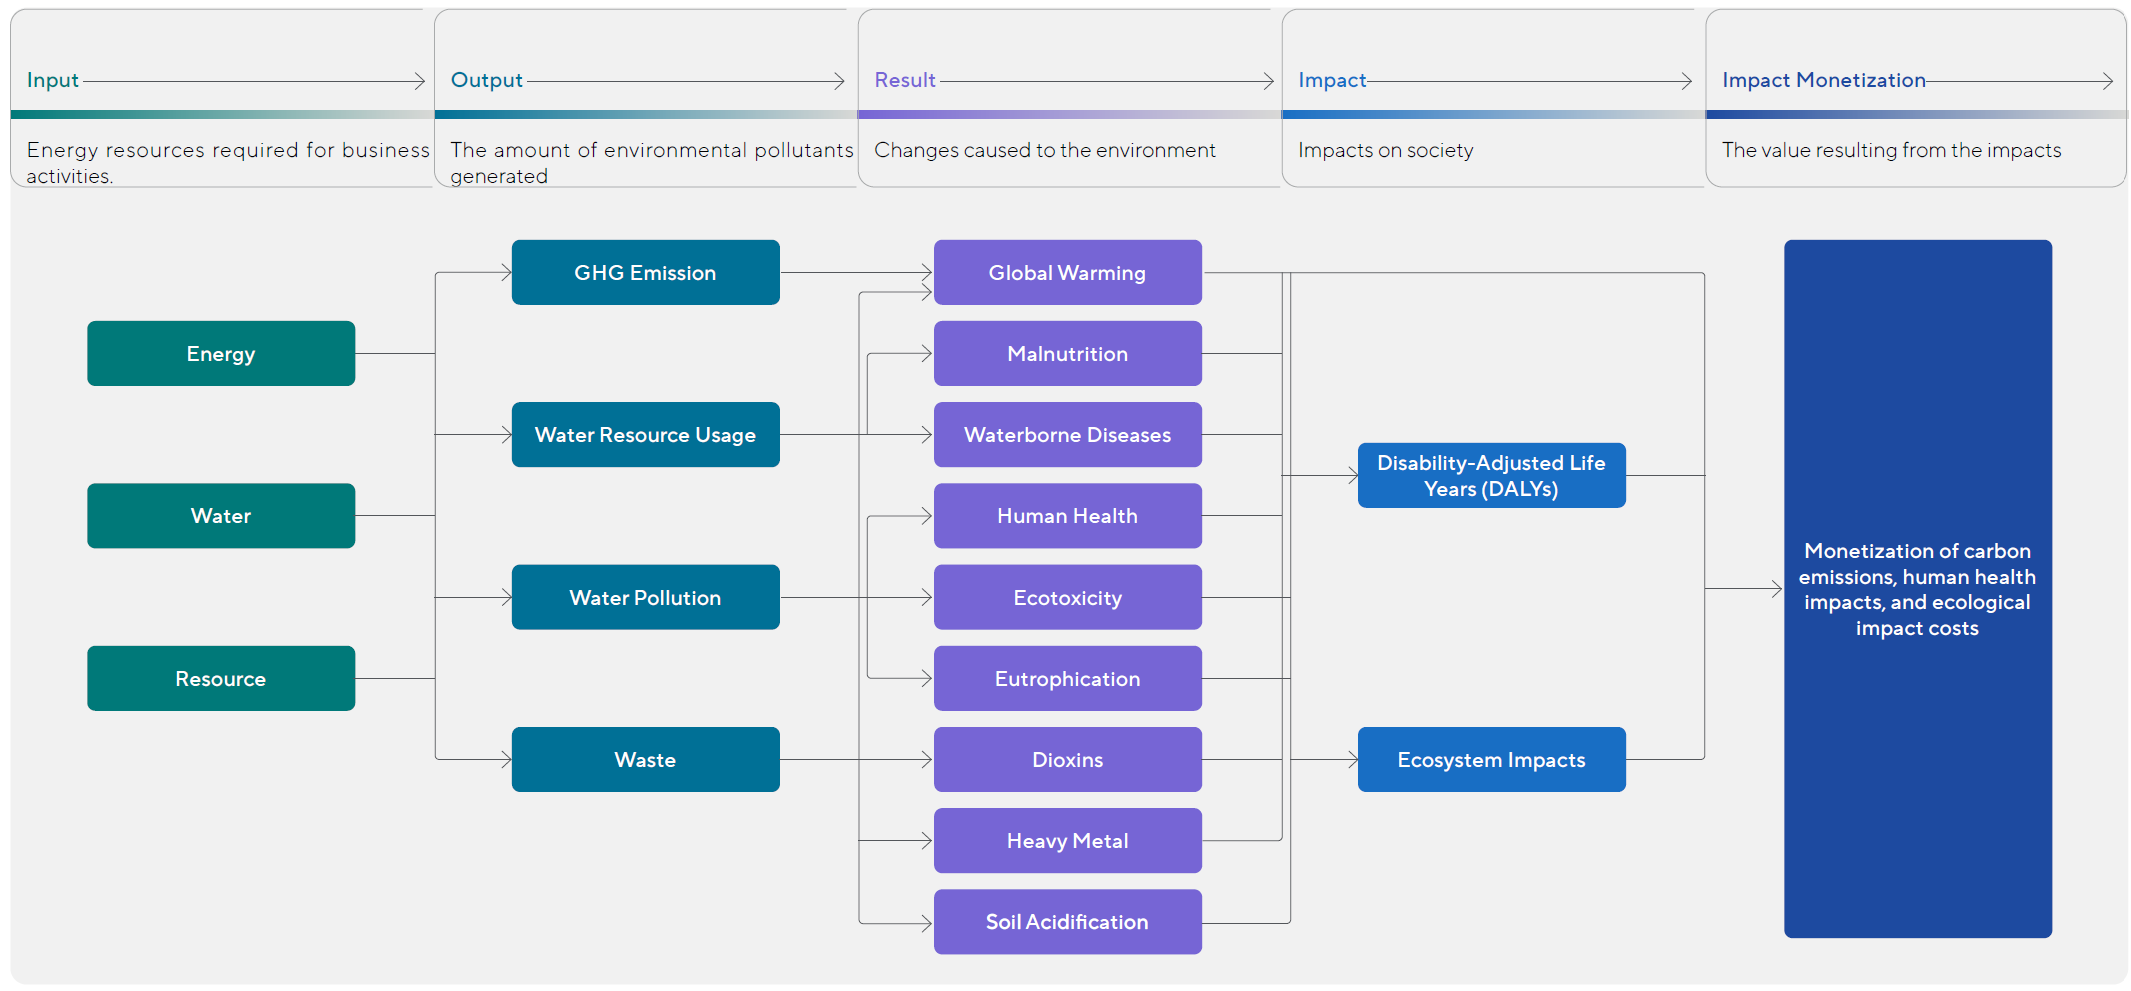
Since 2018, ASUS has adopted Environmental Profit and Loss (EP&L) assessment as a core tool for measuring the environmental impacts of its value chain. Based on the ISO 14040 life cycle assessment standard, PwC’s environmental impact monetization methodology, and the Natural Capital Protocol, ASUS applies Input-Output Analysis (IOA) to comprehensively evaluate energy and resource inputs throughout the value chain and convert environmental outputs into quantifiable impacts. ASUS monetizes the environmental profit and loss of its main products—which account for 90% of revenue (laptops, desktops, motherboards, monitors, and smartphones)—with a focus on the external costs of four environmental indicators: greenhouse gas emissions, water resources, water pollution, and waste. This enables precise management of operational activities and optimization of biodiversity strategies.
Recognizing that historical monetization factors are based on past research data and may no longer accurately reflect current conditions due to methodological advancements and changes in environmental and social contexts, ASUS has comprehensively updated its monetization factor database with the latest parameters. Building on Disability-Adjusted Life Years (DALY), ASUS has integrated ecosystem impact pathways and monetized both human health and ecosystem impact costs, thereby providing a more accurate reference for biodiversity-related decision-making.
Boundaries and Scope
In accordance with the definition in the Product Category Rules (PCR), ASUS defines the boundaries and scope to cover the main components and supply chains of products that account for 90% of its revenue:
- Value chain: Tier 3 raw materials, Tier 2 components, Tier 1 assembly by contract manufacturers, and Tier 0 ASUS operations, including product design, validation, and marketing activities.
- Main components: CPU, memory, display, GPU, resistors, capacitors, motherboards, connectors, mechanical parts, hard drives, cables, batteries, power supplies, keyboards, and packaging.
- Environmental impact indicators: greenhouse gases, water resources, waste, and water pollution.
Environmental Footprint Data Collection
Following the 2024 assessment of operational activities and value chain environmental footprints, ASUS reports the current status for water resources, solid waste, and greenhouse gases as follows:
Water Resource
Water Resource Usage
- In terms of freshwater resources, motherboard suppliers and display manufacturers consume the most water, with the highest annual water withdrawal and wastewater discharge occurring in the downstream Pearl River Delta in China, followed by the Yangtze River Delta.
- Overall, the value chain’s operational water resources are primarily sourced from municipal water utilities, with only 10% coming from other sources such as surface water and groundwater.
Water Pollution
- Panel, motherboard, chip, and EMS contract manufacturing suppliers have relatively high levels of wastewater pollution discharge.
- Annual wastewater volumes are also highest in the downstream Pearl River Delta in China, followed by the Yangtze River.
Value Chain Water Resource Usage and Water Pollution Inventory
Solid Waste
The primary waste output from value chain and operational activities is general industrial waste, accounting for over 70% of the total. Among these, general waste generated after the processing of system components is the highest, with a recycling rate of up to 80%.
Hazardous industrial waste is primarily generated by motherboard suppliers and assembly plants, mainly due to the extensive use of organic solvents during production and the offcuts produced after processing. The recycling rate for hazardous waste can reach 52%.
Value Chain Waste Categories
Value Chain Waste Disposal Methods
GHG Emission
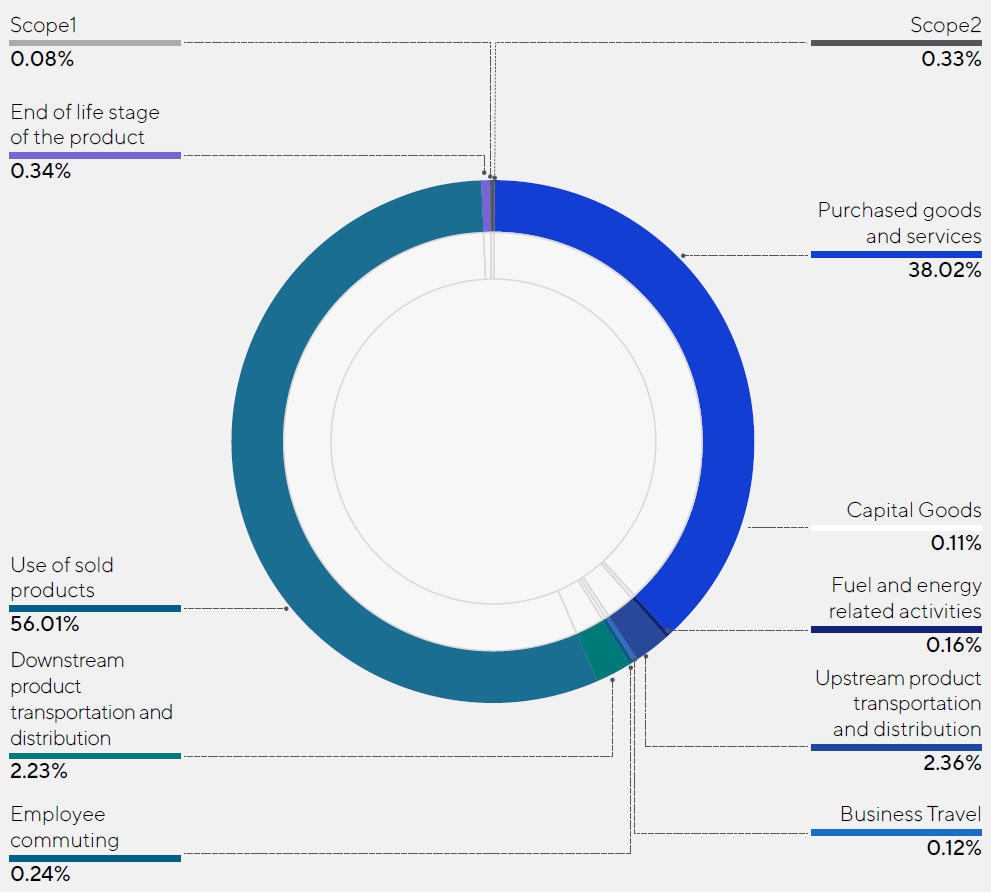
According to the 2024 inventory results, Scope 1 (direct emissions) and Scope 2 (indirect emissions from purchased electricity) account for only 0.41%, as ASUS has reduced these emissions by expanding renewable energy use and replacing high-energy-consuming equipment.
Scope 3 (other indirect emissions in the value chain) is dominated by product energy efficiency (56.01%) and supply chain procurement (38.02%) as the largest contributors to carbon emissions.
As the primary environmental impact indicator, ASUS manages risks and opportunities related to greenhouse gases. Please see details at 2024 TCFD Report.
Environmental Profit and Loss Analysis Results
The results of the Environmental Profit and Loss analysis are as follows: greenhouse gases account for the highest share at 53.07%, followed by freshwater resources—comprising wastewater pollution at 45.32% and water resource usage at 0.88%—and waste at 0.73%.
2024 Category Breakdown
| Category | 2022 | 2023 | 2024 |
|---|---|---|---|
| GHG Emission | 218 | 235 | 363 |
| Water Pollution | 392 | 442 | 311 |
| Waste | 13 | 13 | 5 |
| Water Resource Usage | 3 | 3 | 6 |
| Total | 625 | 693 | 685 |
Unit: million dollars
Breaking down further by environmental hotspots for each tier—Tier 0 ASUS operations (design, validation, and marketing), Tier 1 contract manufacturing assembly, Tier 2 components, and Tier 3 raw materials (as shown in the figure):
- Greenhouse gases: The primary impacts are concentrated in Tier 1 and Tier 2 of the value chain, mainly from energy consumption and process emissions, indicating that carbon reduction remains ASUS’ top environmental management priority. The relative increase in greenhouse gas emissions in 2024 is mainly due to updates to monetization factors and increased procurement from upstream suppliers.
- Wastewater pollution: Accounting for 45.32% of total environmental impact, wastewater pollution is the second-largest environmental factor. It primarily originates from the use of chemicals and cleaning activities in production processes, highlighting the need to strengthen wastewater discharge management.
- Water resource usage: Water usage accounts for 0.88%, with the majority concentrated in water-intensive manufacturing processes. In the future, water recycling, reuse, and efficiency optimization should be strengthened to address the increasing global pressure on water resources.
- Solid waste: The greatest environmental impacts occur during the raw material extraction and component manufacturing stages. ASUS headquarters adheres to a zero-landfill standard, reducing waste generation and environmental burdens by improving process efficiency, promoting a circular economy, and expanding material recycling. ASUS also collaborates with suppliers to enhance waste management at the production stage and promote resource reuse.
Compared to climate change, which can be addressed through global-scale mitigation and removal of greenhouse gas emissions to achieve unified targets such as limiting warming to within 1.5°C, biodiversity issues involve highly complex interactions between freshwater, marine, and terrestrial natural capital and human activities. Due to variations in geographical conditions and sources of pressure, biodiversity management requires more region-specific assessment and management approaches.
Tier 0
Tier 1
Tier 2
Tier 3
Risk and Opportunity Identification
Based on the environmental hotspot analysis results1ASUS focused on freshwater resources—the second-largest environmental impact—and, in accordance with the TNFD guidance and the Network for Greening the Financial System’s report Nature-related Financial Risks: A Conceptual Framework to Guide Action by Central Banks and Supervisors, identified nature-related risks and opportunities for its operations and key suppliers.
ASUS defines nature-related risks as follows:
- Physical risks: Water resource usage, where ASUS’ access to water resources may be reduced due to environmental degradation and the loss of ecosystem services, potentially resulting in economic losses for ASUS and its supply chain.
- Transition risks: The likelihood of facing stricter regulations on water resources, soil, and waste, with an expanded regulatory scope for the supply chain in the future, requiring the development of corresponding measures.
| Impact Categories | Risk Classification | Sources of Risk | Risk Categories | Risk Identification | Risk Description |
|---|---|---|---|---|---|
| Fresh Water Resource | Physical risks | Taiwan | Climate Change and Local Hydrology | Freshwater Withdrawal and Discharge | Extreme weather events, such as reduced precipitation combined with local water resource usage, can result in water scarcity. |
| Physical risks | Suppliers | Climate Change and Local Hydrology | Freshwater Withdrawal and Discharge | Rainfall patterns combined with local water resource usage can lead to local water stress. | |
| Transition risks | Policies and regulations | Pilot Implementation Measures for Water Resource Tax Reform | The shift from water fees to water taxes reflects stricter regulations on water resource usage. For example, a valueadded tax of approximately 3–10% may be imposed, and water consumption exceeding 20% of the planned allocation may be subject to a tax more than double the standard rate. | ||
| Soil and Solid Waste | Transition risks | Suppliers | Policies and regulations | China Soil Pollution Source Prevention and Control Action Plan | Regulations on soil and waste are becoming more stringent, with increasing requirements for information disclosure. |
| Impact Categories | Risk Classification | Sources of Risk | Stages of Occurrence2 | Impact Scenarios (Event Outcome) | Impact on ASUS |
|---|---|---|---|---|---|
| Fresh Water Resource | Physical risks | Taiwan | In the long term, within the next 10 years, reduced rainfall and increased local water usage may occur. | Operational headquarters water shortage and work suspension:
|
Source of impact: ASUS Level of impact: Medium Impact on ASUS: Increase in operating expenses |
| Physical risks | Suppliers | In the long term, within the next 10 years, reduced rainfall and increased local water usage may occur. | Supply chain production efficiency decline or suspension due to water outage:
|
Source of impact: Suppliers Level of impact: High Impact on ASUS: Decrease in operating revenue / Increase in expenses |
|
| Transition risks | In the near term, implementation across all provinces is expected within 1 to 3 years. | Supply chain water resource management:
|
Source of impact: Suppliers Level of impact: High Impact on ASUS: Increase in operating expenses |
||
| Soil and Solid Waste | Transition risks | Suppliers | In the near term, implementation across all provinces is expected within 1 to 3 years. | Supply chain waste management:
|
Source of impact: Suppliers Level of impact: Medium Impact on ASUS: Increase in operating expenses |
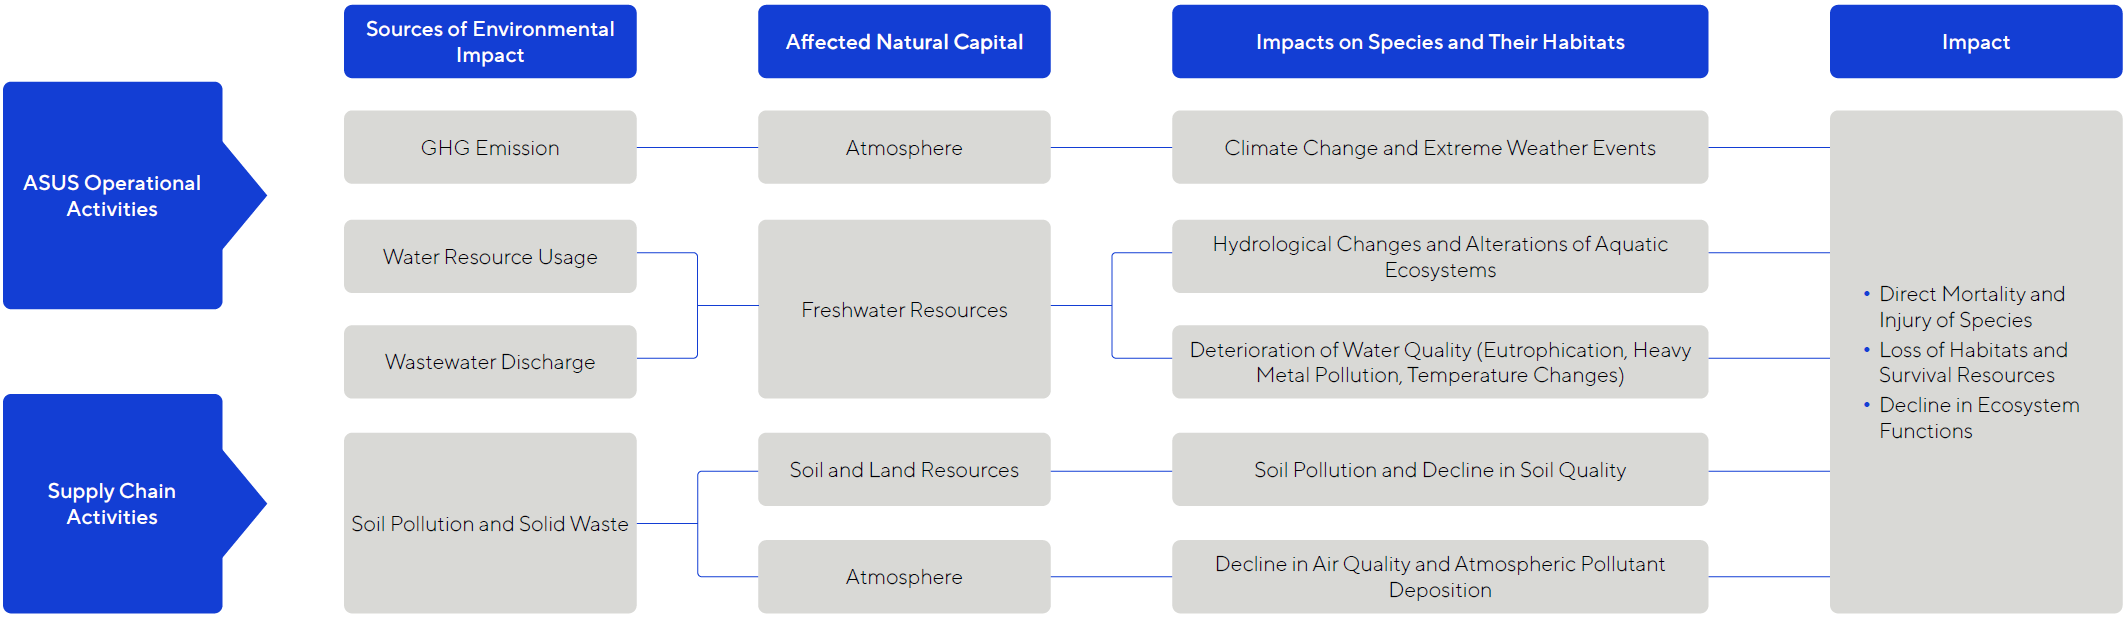
Based on the risk and opportunity assessment, for suppliers with relatively high freshwater risks, ASUS adopted the LEAP (Locate, Evaluate, Assess, Prepare) methodology recommended by the TNFD framework to further overlay the geographic locations of key freshwater suppliers (panel, motherboard, chipset, EMS assembly facilities, battery) with biodiversity hotspot areas. For key suppliers located in biodiversity-sensitive regions, ASUS has enhanced management measures and initiated proactive audits to mitigate impacts on the local environment and biodiversity issues. The following illustrates the impact pathways through which ASUS’ operational activities may indirectly affect biodiversity.
ASUS Natural Capital Impact Pathways
ASUS Value Chain Biodiversity Impact Assessment Tool
In 2023, ASUS identified supplier impacts on biodiversity by utilizing geospatial databases such as the Integrated Biodiversity Assessment Tool (IBAT) and Key Biodiversity Areas (KBA). In 2024, ASUS further enhanced its biodiversity inventory capabilities. Considering that key suppliers are primarily located in mainland China, ASUS incorporated official local biodiversity databases, including data layers for National Nature Reserves, National Wetland Parks, and National Parks, to improve the accuracy and comprehensiveness of overall biodiversity risk assessments.
Biodiversity Impact Assessment of Operational Headquarters on the Local Environment
Last year, the operational headquarters conducted analysis using online databases such as the Integrated Biodiversity Assessment Tool (IBAT) and Key Biodiversity Areas (KBA), and was not located within internationally recognized biodiversity key areas. Considering that overall environmental impacts across the value chain are primarily concentrated in the supply chain, ASUS will focus on supply chain location analysis.
Biodiversity Impact Assessment of Supplier Sites on the Local Environment
ASUS has approximately 700 suppliers worldwide, with around 70% located in mainland China. Among these, about 26% are in the Pearl River Delta region, such as Shenzhen and Guangzhou; approximately 21% are in the Yangtze River Delta region, including Suzhou and Shanghai; around 10% are in the Chongqing area and Central China; and about 4% are in the Eastern Fujian region. Other suppliers are located in the Indochina Peninsula and Taiwan, accounting for approximately 30%.

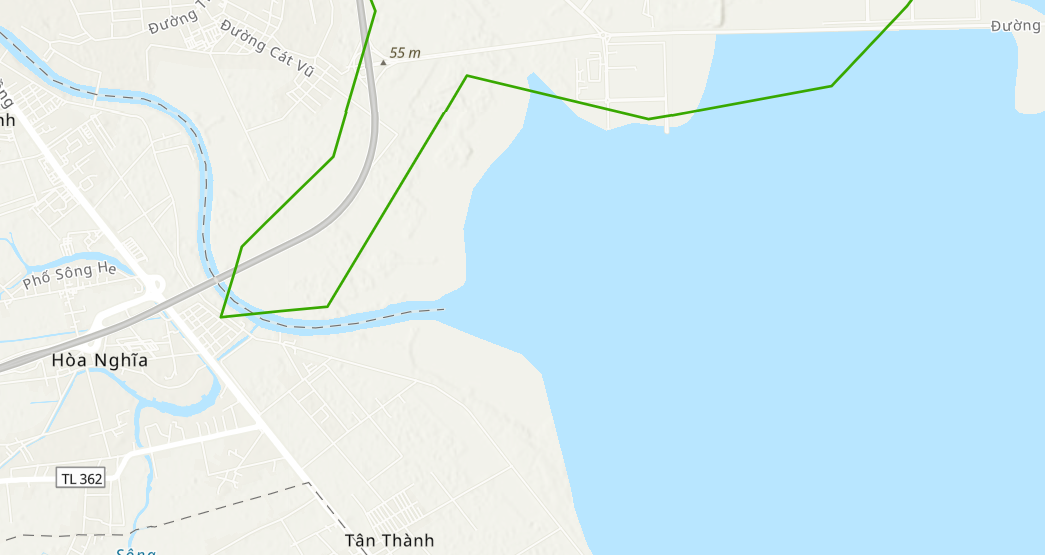
Based on the results of the environmental profit and loss assessment and natural capital impact pathways, ASUS conducted point-based analysis using the latitude and longitude data of key freshwater resource suppliers. This was supplemented with both global biodiversity mapping scales and national-level analyses to evaluate the relationship between supplier sites and biodiversity-sensitive areas, thereby strengthening biodiversity-related audits and management. The 2024 analysis identified one new supplier in Vietnam located near the An Hai Biodiversity Hotspot, and two new suppliers in mainland China situated near3six National Wetland Parks, as illustrated in the figure below. To prevent potential impacts from ASUS suppliers on local biodiversity, newly identified suppliers in 2024 are subject to enhanced biodiversity audits—for example, reviewing biodiversity policies and verifying compliance reports and reduction plans related to wastewater and waste. Suppliers identified in the previous year will continue to be included in the annual audit process to ensure ongoing compliance.。
Through analysis of online databases such as Key Biodiversity Areas (KBA), it was identified that one supplier in Vietnam is located near the local An Hai Biodiversity Hotspot.
According to supplier audit results, the supplier has obtained government approval documents for plant establishment, and based on the local government’s determination, the facility poses no biodiversity-related concerns.
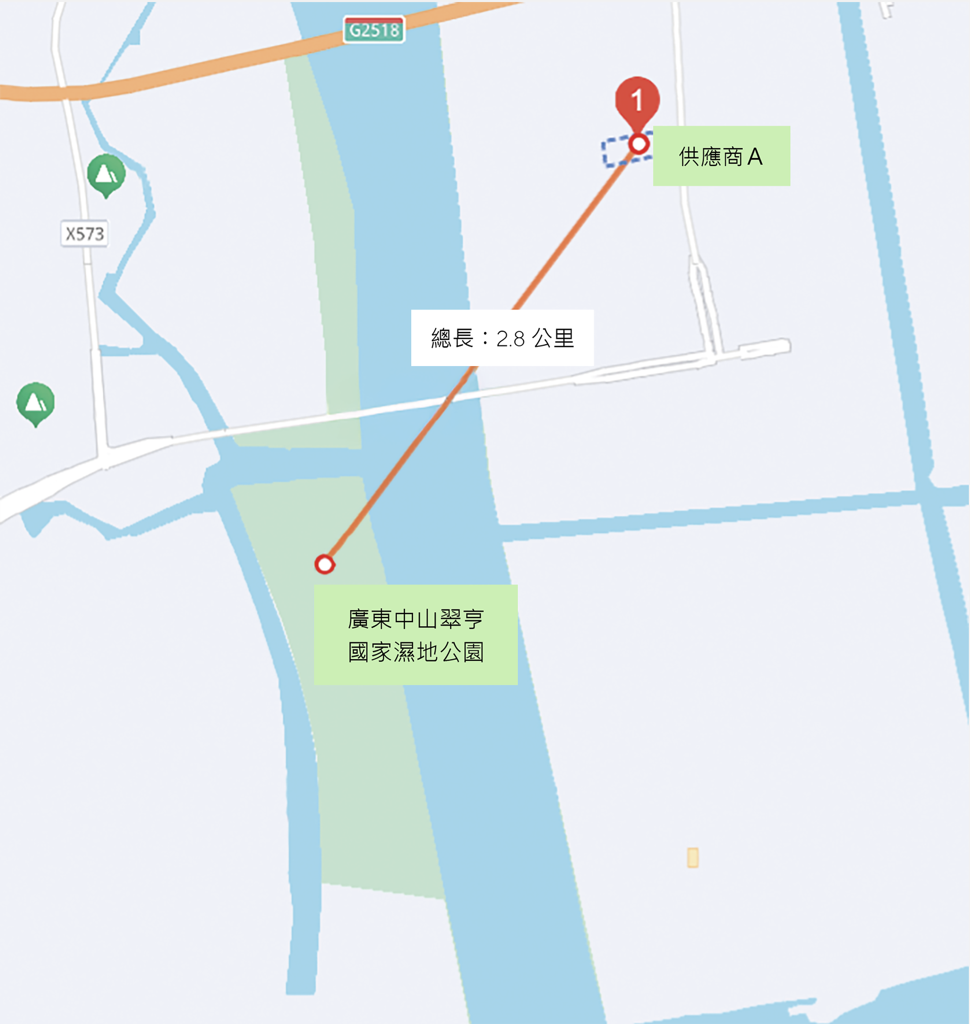
ASUS utilized the database of the Institute of Public and Environmental Affairs (IPE) in mainland China, which indicated that Supplier A is located near the Cuiheng National Wetland Park in Zhongshan, Guangdong. Given its proximity to an ecologically sensitive area, ASUS required the supplier to undertake follow-up actions, such as establishing management mechanisms and enhancing disclosure and communication.
1. Given the fundamental differences between climate and biodiversity assessment methodologies, ASUS has developed tailored plans and responses for each. For greenhouse gases, which represent the most significant impact, comprehensive inventories, management strategies, and actions are disclosed in the dedicated report—Climate-related Financial Disclosure Report. For freshwater resources (wastewater pollution and water usage) and solid waste, management strategies and actions are disclosed in the Natural Impact Assessment Report.
2. Timeframe of occurrence: Near term 1–3 years, Medium term 3–10 years, Long term 10 years and beyond.
3. Definition of Proximity: Referring to the Nature Positive Initiative (NPI), the assessment is based on a maximum range of 5 kilometers from areas where endangered species may be affected.